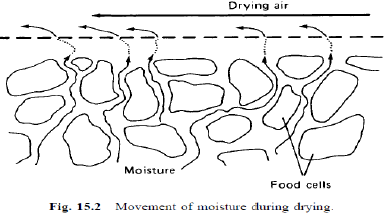
Drying Curve
- Drying curve usually plots the drying rate versus drying time or moisture contents.
- Three major stages of drying can be observed in the drying curve.
- Transient early stage, during which the product is heating up (transient period)
- Constant rate period, in which moisture is comparatively easy to remove
- Falling rate period, in which moisture is bound or held within the solid matrix
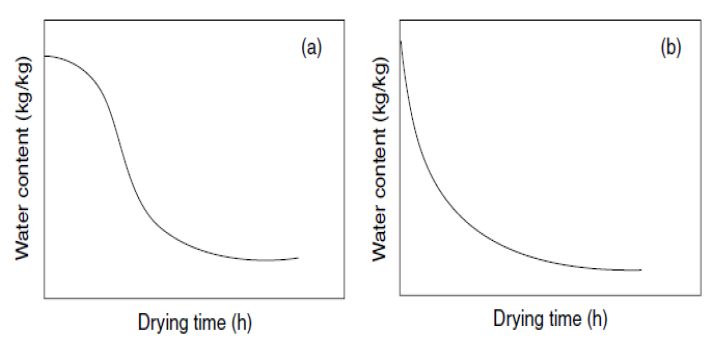
Typical drying curves (water content versus drying time): (a) with a lag period, (b) without a lag period
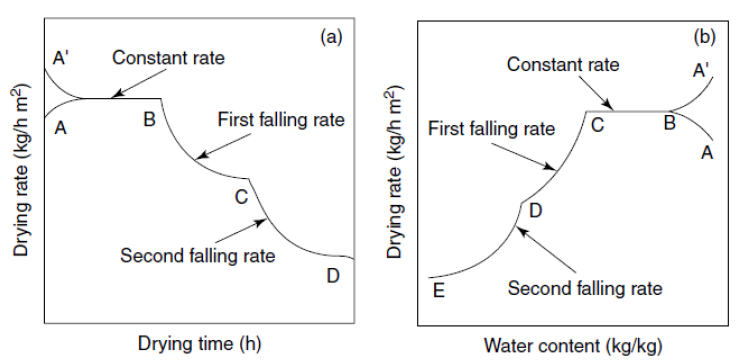
Typical drying rate curves: (a) drying rate versus drying time and (b)drying rate versus water content
- Critical moisture content: The moisture content at the point when the drying period changes from a constant to a falling rate.
- The drying behaviours of food materials depend on the porosity, homogeneity, and hygroscopic properties.
- Hygroscopic food materials enter into the falling rate faster compared to non-hygroscopic food materials.